Advancing Puerto Rico's Innovation: A Comprehensive Analysis of the Research and Development Ecosystem
Authors: Ubaldo M. Córdova-Figueroa, PhD & Valeria A. Cruz-Zapata, M.Eng. IE
Executive Summary
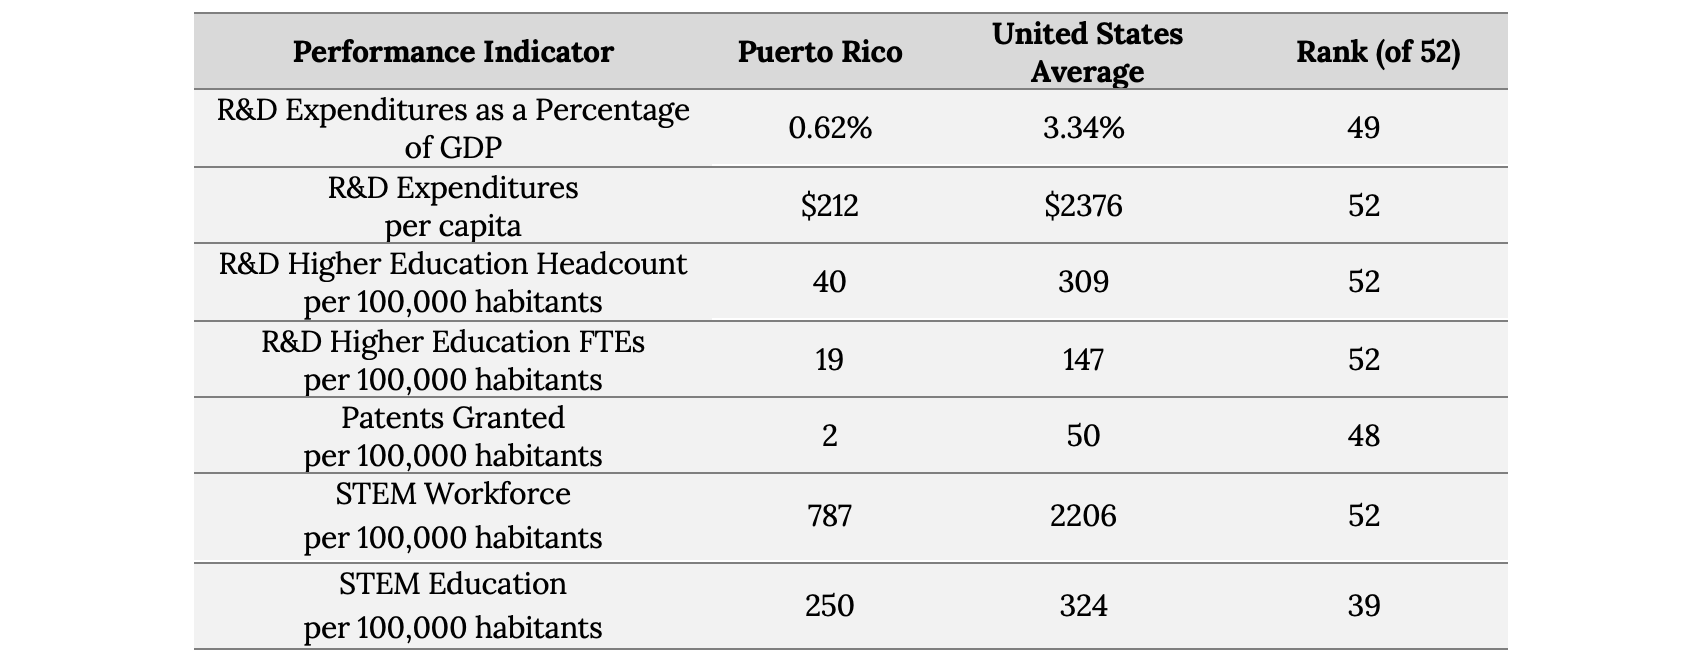
This analysis offers a thorough examination of Puerto Rico's research and development (R&D) landscape in numbers, highlighting trends, benchmarks, challenges, and opportunities, while presenting strategic recommendations to promote innovation and sustainable economic development. Leveraging from diverse information sources, including local and federal governmental agencies and statistical repositories, this analysis provides an understanding of Puerto Rico's R&D performance and challenges. Key findings reveal notable disparities in R&D expenditures, workforce dynamics, patent activities, and STEM education compared to national averages.
Comparison of R&D Performance Between Puerto Rico and United States
In this report, the need for investment and policy intervention is highlighted to advance and align R&D efforts in Puerto Rico. By implementing strategic recommendations and fostering a conducive environment for research-driven economic growth, Puerto Rico has the potential to emerge as a dynamic hub for innovation, otherwise, as other jurisdictions continue to grow, Puerto Rico’s national and global impact and leadership will be limited.
Glossary
Research and Development (R&D) – “creative and systematic work undertaken in order to increase the stock of knowledge – including knowledge of humankind, culture and society – and to devise new applications of available knowledge.” [1]
Expenditures – the amount of money spent on R&D activities.
Headcount – refers to the total number of individuals working on research and development activities.
Full-time Equivalent (FTE) – measures the total amount of full-time employees working in an organization.
Publication – refers to the act of sharing and disseminating research results, findings, and conclusions through a formal written report or article in a scientific journal or conference proceedings.
Citation – is a reference to a source that has been used in the creation of a piece of work, such as a scientific paper, book, or article.
U.S Total – total sum, of a specific metric, of all U.S. states and territories.
U.S. Average – total sum, of a specific metric, of all U.S. states and territories divided by the total U.S. population.
Introduction
Research and development (R&D) is vital for driving innovation and progress worldwide. With its rich cultural heritage and diverse economy, Puerto Rico is at a crucial point where investing in R&D can unlock new opportunities and spur transformative growth.
Puerto Rico's R&D landscape involves various players, such as academic institutions, government agencies, and businesses. Understanding this complex landscape requires analyzing R&D spending, workforce participation and size, patent activities, and education systems. By doing so, stakeholders and policymakers can grasp the patterns, challenges, and opportunities shaping Puerto Rico's R&D scene, aiding informed decision-making and targeted actions.
Investing in R&D allows nations and jurisdictions to harness their talents, promote collaboration across sectors, and use emerging technologies to tackle challenges and grasp new opportunities. R&D also guides societies towards a future marked by resilience, sustainability, and growth.
This analysis aims to offer a detailed look into Puerto Rico's R&D landscape, highlighting trends, challenges, and opportunities. By combining data, strategic suggestions, and policy insights, this analysis aims to empower the people of Puerto Rico towards a future driven by innovation, creativity, and shared prosperity.
Methodology
Understanding the R&D landscape in Puerto Rico required a comprehensive methodology. This involved several key steps aimed at analyzing the current state of R&D activities, identifying challenges and opportunities, defining relevant metrics, mapping strategic sectors, and formulating policy recommendations to support R&D endeavors.
Central to the approach was the recognition of the inherent challenges associated with data collection and metrics in assessing R&D activities. In response, efforts were made to identify and define key performance indicators (KPIs) crucial for measuring progress and success. This process entailed careful consideration to select metrics most pertinent to tracking R&D activities and outcomes specific to Puerto Rico. By establishing clear KPIs, stakeholders and policymakers can effectively measure the progress and impact of interventions, thereby facilitating informed decision-making. Establishing both the current state and the desired future state of the R&D ecosystem provides a clear roadmap for improvement, while transparency and visibility ensures that stakeholders understand the objectives and progress of R&D efforts.
A significant aspect of the strategy involved mapping the opportunity landscape within strategic sectors. Through strategic analysis, sectors with high potential for R&D investment and growth were identified. Strategic allocation of resources has the potential of leveraging Puerto Rico's strengths and competitive advantages, maximizing the impact of interventions and fostering sustainable economic development. This targeted approach ensures that interventions are directed towards areas where they can yield the greatest impact, fostering a conducive environment for innovation and growth.
Moreover, policy recommendations were developed aimed at supporting and incentivizing R&D activities. These recommendations were designed with the goal of fostering innovation, attracting investment, and creating an enabling environment conducive to R&D-driven economic growth.
In general, this approach emphasizes the need for a new economic development framework and operating system that integrates various stakeholders and fosters collaboration. By forging partnerships between government, academia, and industry, Puerto Rico can leverage collective expertise and resources to address complex challenges and seize emerging opportunities. This collaborative approach ensures that initiatives are holistic, adaptable, and responsive to evolving needs, laying the foundation for long-term success.
Economic Development Plan Analysis
In response to Puerto Rico’s economic challenges, the Department of Economic Development and Commerce (DEDC) developed in 2022 the framework called PRopósito. This economic framework provides a strategic roadmap designed to revitalize the island's economy and position it for long-term success. It emphasizes collaboration and innovation, recognizing that sustainable economic development requires the active participation of diverse stakeholders, including private companies, non-profit organizations, business associations, and government entities [2]. Embracing the lessons learned from past endeavors, the framework also emphasizes the importance of integrated, evidence-based strategies that leverage Puerto Rico's unique strengths and assets.
Central to PRopósito is the objective of increasing R&D activity as a catalyst for innovation, competitiveness, and economic growth. Recognizing the transformative potential of R&D, it outlines several key strategies and efforts to advance this objective. These strategies include the development of R&D capabilities, the transformation of the University of Puerto Rico into a global leader in critical research areas, the establishment of an R&D committee to coordinate efforts, the regular conduct of research and development surveys to inform policymaking, and strategic partnerships with institutions like the University of Puerto Rico - Mayagüez to support specific areas of research, such as aerospace and food technology.
In summary, the economic development framework for Puerto Rico presents a roadmap for driving innovation, fostering R&D activities, and promoting economic prosperity. However, while the plan outlines ambitious goals and strategies, its success will ultimately depend on effective implementation and sustained commitment and continuity from all stakeholders. It lacks operational and practical recommendations for addressing the areas of interest in R&D for Puerto Rico. It does not provide specific guidance on how to effect change in this crucial sector for the economy. By capitalizing on its strengths, fostering collaboration, and maintaining a flexible and adaptive approach, Puerto Rico has the potential to emerge as a dynamic hub for R&D, driving sustainable growth.
Data and Information Sources
To understand the landscape of research and development (R&D) in Puerto Rico, a variety of sources were used, each offering unique perspectives and datasets. These sources include the following governmental agencies, surveys, and statistical repositories:
National Science Foundation (NSF) - serves as a resource for understanding broader trends in R&D. It offers insights into funding distributions, emerging fields of study, and educational initiatives across diverse scientific disciplines.
National Center for Science and Engineering Statistics (NCSES) - It provides comprehensive statistical data and reports on topics such as research and development (R&D) funding, scientific workforce demographics, innovation, technology trends, and more.
Higher Education Research and Development (HERD) Survey: Conducted annually by the NCSES, provides detailed data on R&D expenditures within U.S. colleges and universities. It provides comprehensive information on R&D spending by academic institutions, including expenditures by source of funds (federal government, state and local governments, industry, and institutional funds) and headcount.
National Patterns of R&D Resources: This resource delves into R&D expenditures across various sectors, including industry, government agencies, academic institutions, and nonprofit organizations. It also provides insights into the contributions of different sectors to overall R&D activity.
Individuals in Science and Engineering Occupations: Provides insights into the distribution of science and engineering (S&E) occupations at the state and territory level.
Science and Engineering Degrees Conferred: Provides data related to the degrees in science and engineering awarded by state and territories.
Instituto de Estadísticas de Puerto Rico (IEPR): Through the Science and Technology Survey, it provides statistical information specific to Puerto Rico’s R&D landscape. It also provides data related to patents granted to Puerto Rico.
Science and Technology Survey (2022): Survey conducted by the Department of Economic Development and Commerce (DDEC) to know how much is invested and what the structure of the local and subsidiary companies on the island related to research and development.
U.S. Patent and Trademark Office: This agency provides data pertaining to patents and trademarks granted by the United States government.
United States Census Bureau: Provides extensive datasets on demographics and population.
Data Analysis and Findings
The R&D landscape in Puerto Rico exhibits distinct trends and notable differences when compared to the United States. The data reveals patterns in expenditures, workforce, and outputs such as patents and publications. This analysis aims to provide insights into the R&D ecosystem in Puerto Rico over the past decade and its comparison with the broader U.S. context.
Research and Development Expenditures
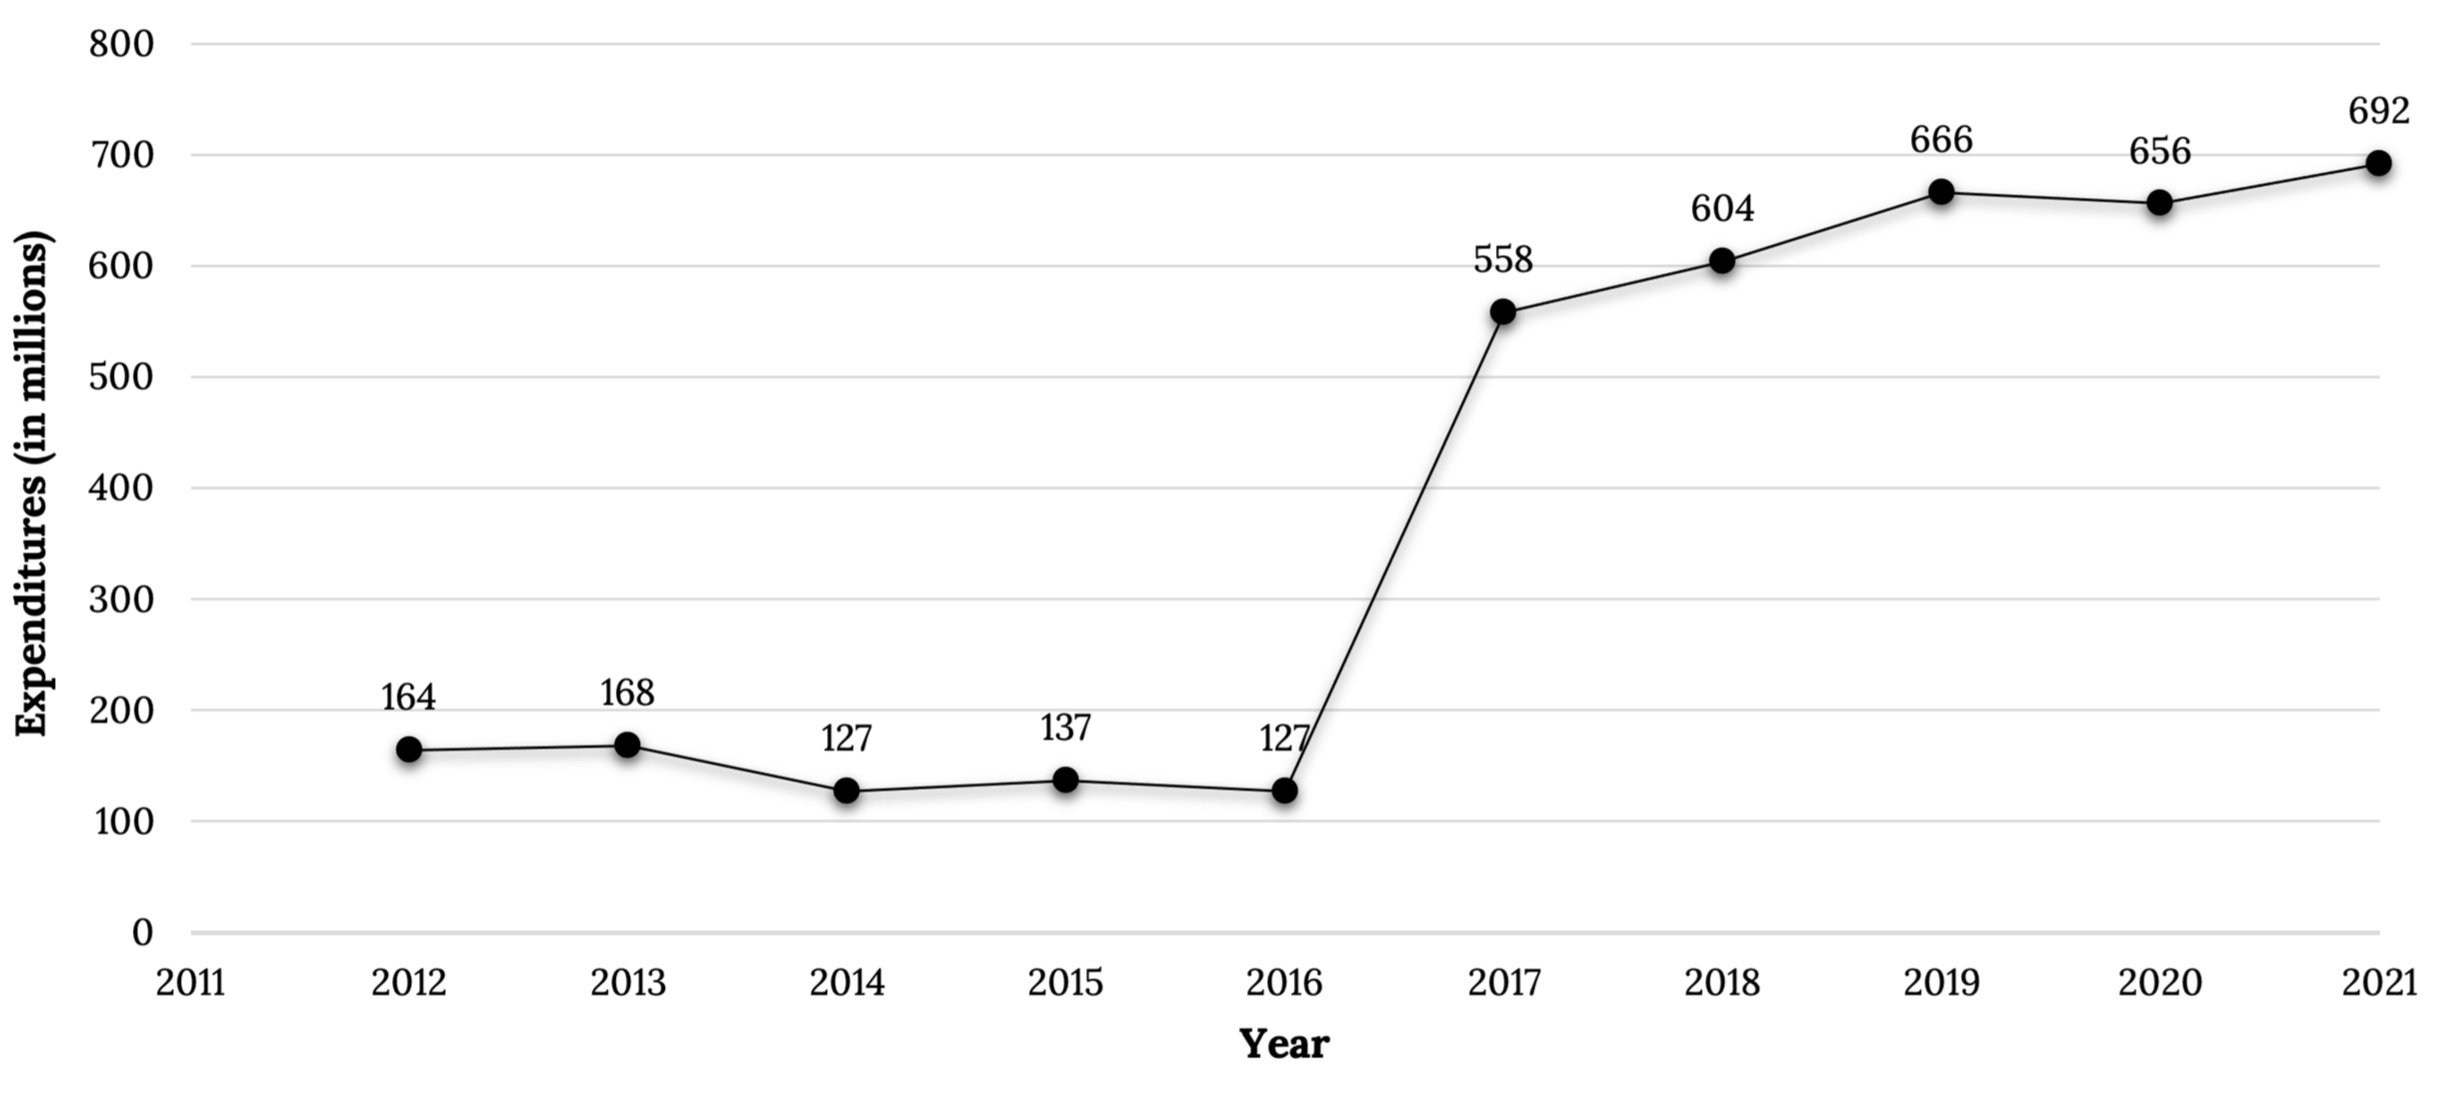
Expenditures refer to the funds allocated towards R&D activities within a specific region or entity. These expenditures include investments made by various sectors such as higher education, industry, and government. Table 1 shows R&D expenditures for Puerto Rico for a ten-year period (2012 to 2021).
Table 1: R&D Expenditures in millions
Figure 1: Puerto Rico R&D Expenditures in millions from 2012 to 2021. The graph depicts R&D expenditures in Puerto Rico from 2012 to 2021, showcasing a significant trend change. It is important to highlight that from 2012 to 2016, data on business R&D performance in Puerto Rico was not collected by the source. Consequently, there is a notable difference between the R&D expenditures from 2012 to 2016 and from 2017 forward.
When comparing R&D expenditure patterns between the United States and Puerto Rico (Table 2), notable distinctions emerge across various sectors. Higher education institutions in Puerto Rico contribute a higher proportion (18%) of total R&D expenditures compared to their U.S. counterparts (11%), indicating a significant involvement of academic institutions in research endeavors. Conversely, Puerto Rico allocates a smaller portion (4%) of R&D funds to government in stark contrast to the US, where these sectors collectively account for 9% of total R&D spending. However, both regions share a similarity in directing a substantial portion, approximately three-quarters, of R&D investments into business activities.
Table 2: Percentage of R&D Expenditures (2021)
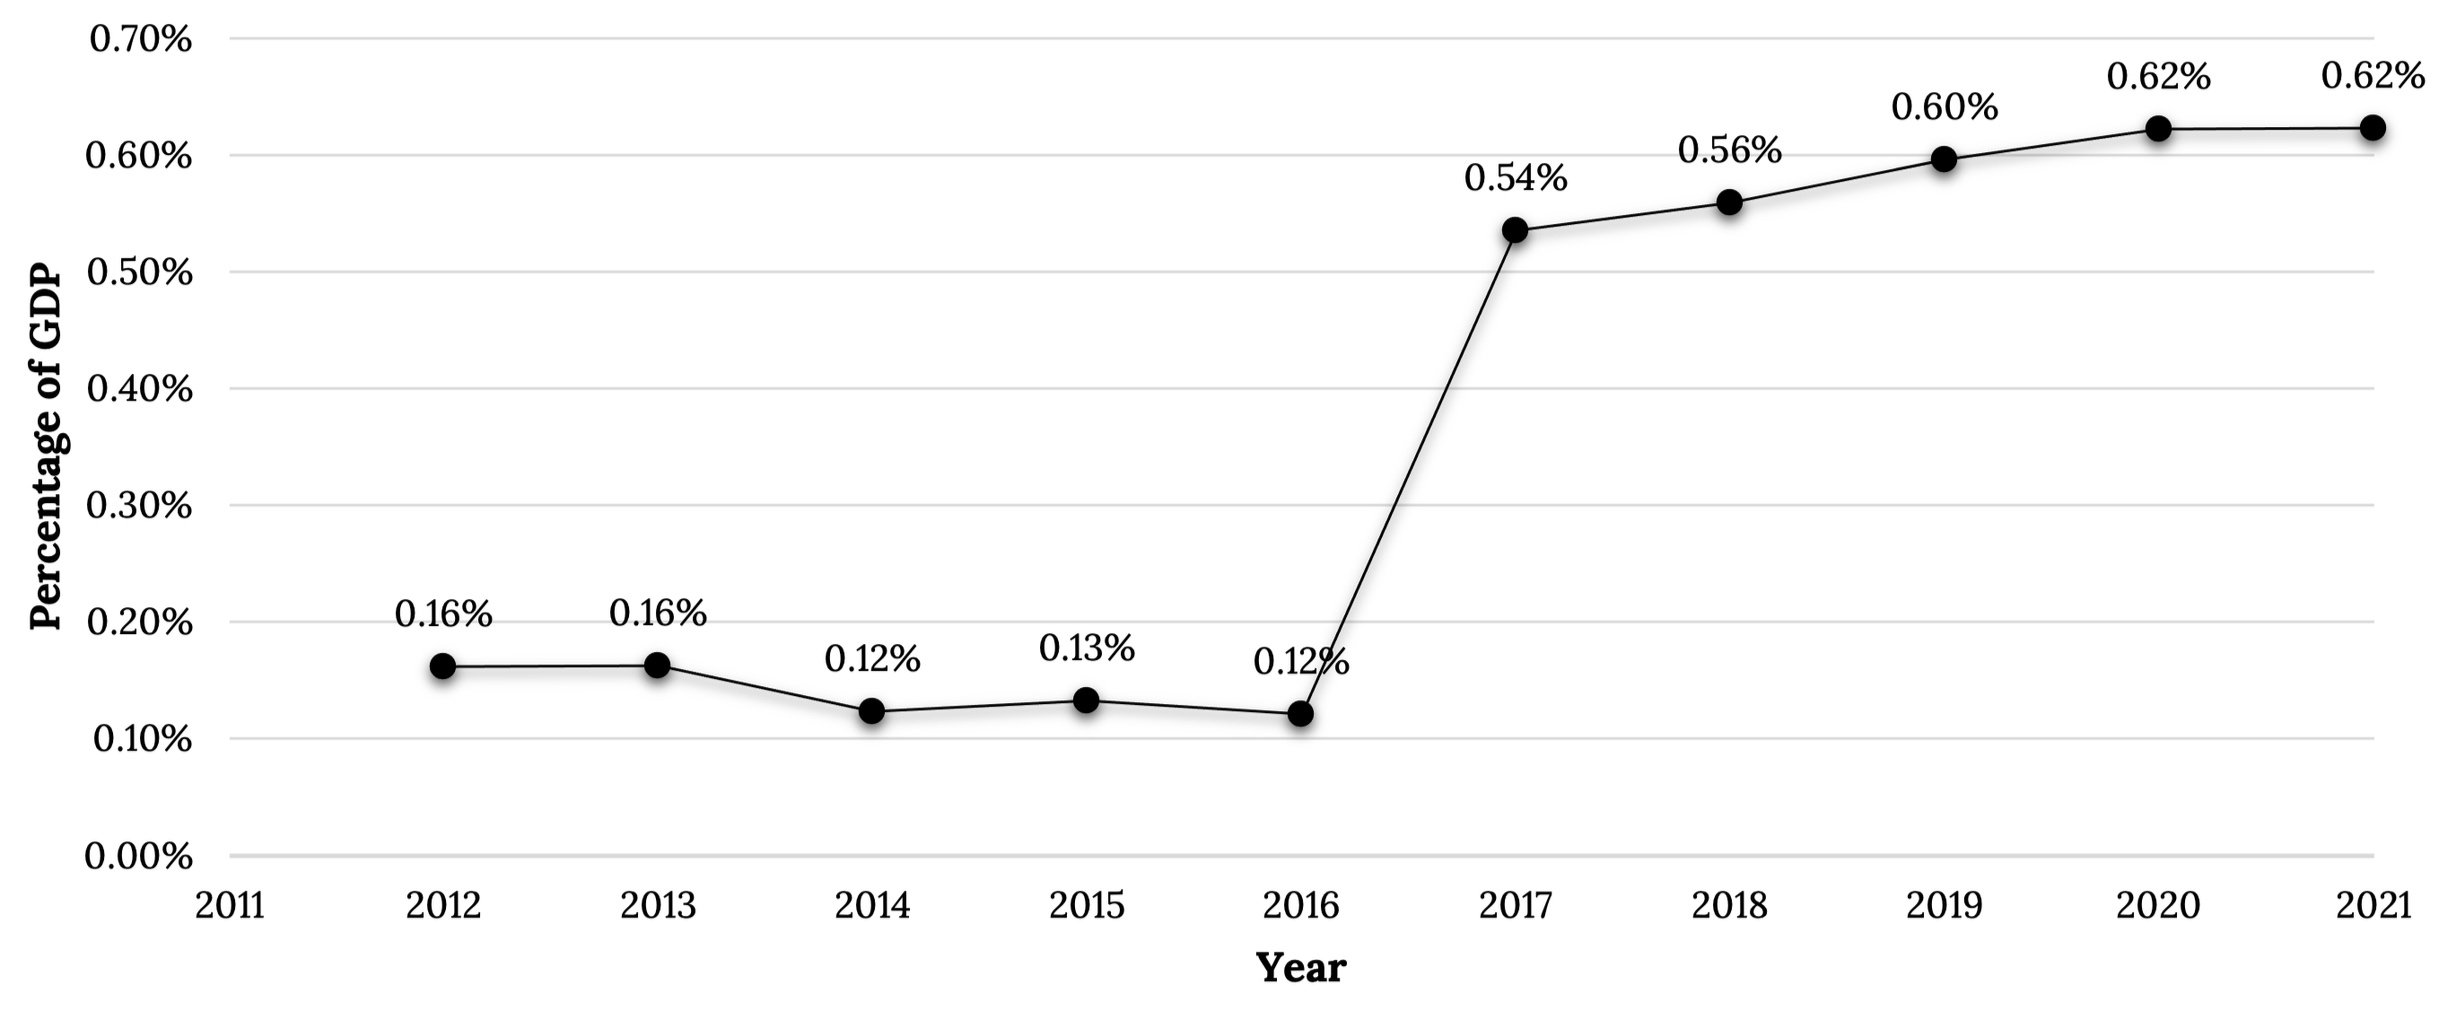
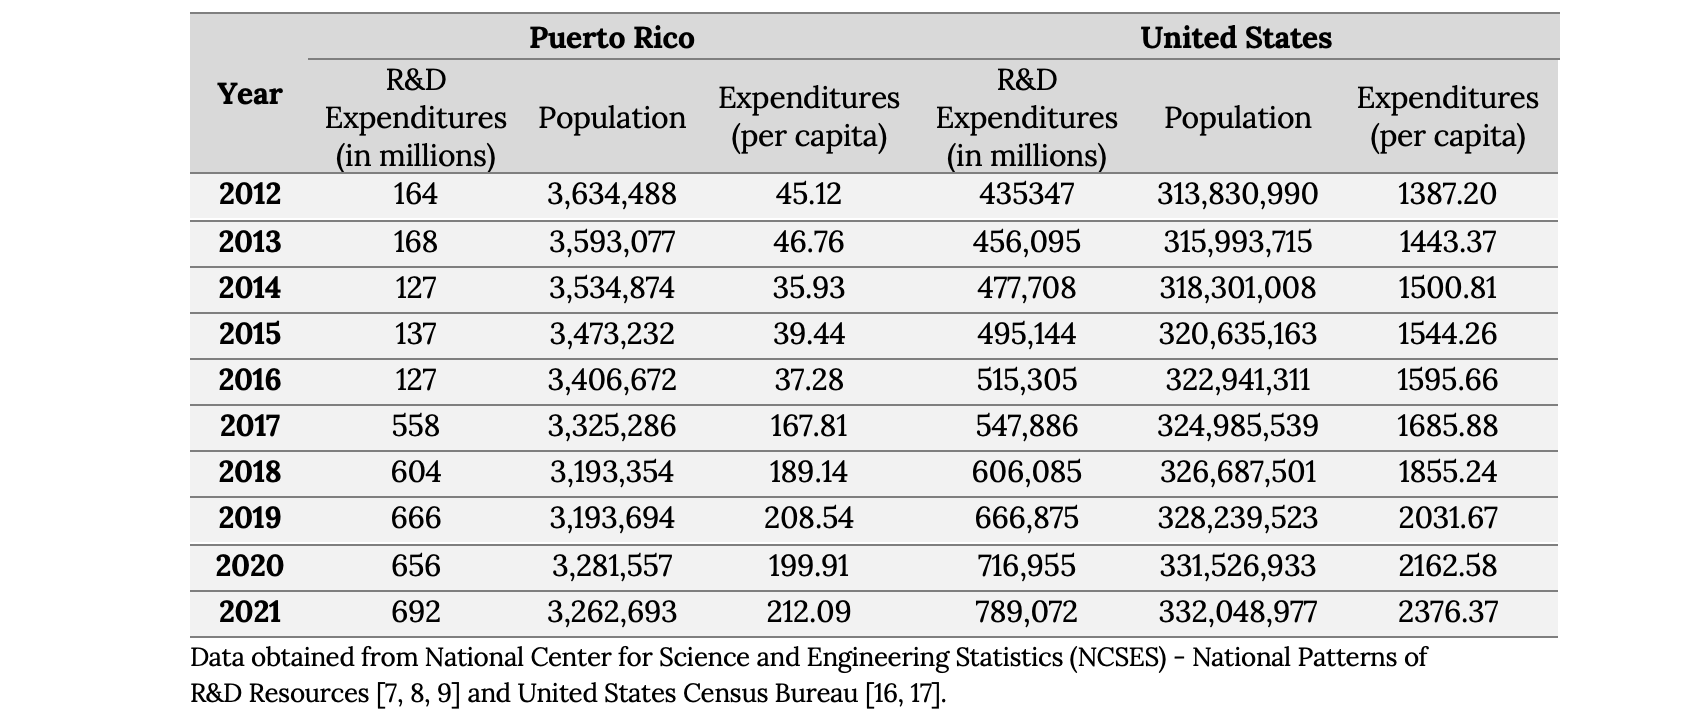
Comparing R&D expenditures to Gross Domestic Product (GDP), as shown on Table 3, provides insight into the intensity of R&D activities relative to the economic output of a region. In 2021, Puerto Rico's R&D expenditures were $692 million, while the United States' R&D expenditures were $789,072 million [8]. To fairly compare Puerto Rico's R&D expenditures with those of the United States, the expenditures were normalized by considering the percentage of GDP dedicated to R&D. In this context, Puerto Rico's R&D expenditures represented 0.62% of its GDP, whereas the United States allocated 3.34% of its GDP to R&D. This normalization allows for a more equitable comparison between the two regions, accounting for differences in their economic scales. This positions Puerto Rico at #49 out of 52 when compared to all states and territories in terms of R&D spending as a percentage of GDP (Appendix A). Figure 2 shows PR’s R&D expenditures for the last ten years as a percentage of its GDP.
Table 3: Expenditures & GDP (PR & US)
Figure 2: Puerto Rico R&D Expenditures as a Percentage of its GDP from 2011 to 2021. The graph illustrates R&D expenditures as a percentage of GDP in Puerto Rico from 2011 to 2021. Without including data on business R&D performance from 2011 to 2016, the percentage remained relatively stable, ranging between 0.12% and 0.16%. Starting in 2017, the percentage rises slightly from 0.54% to 0.62% by 2020 and maintaining that level in 2021.
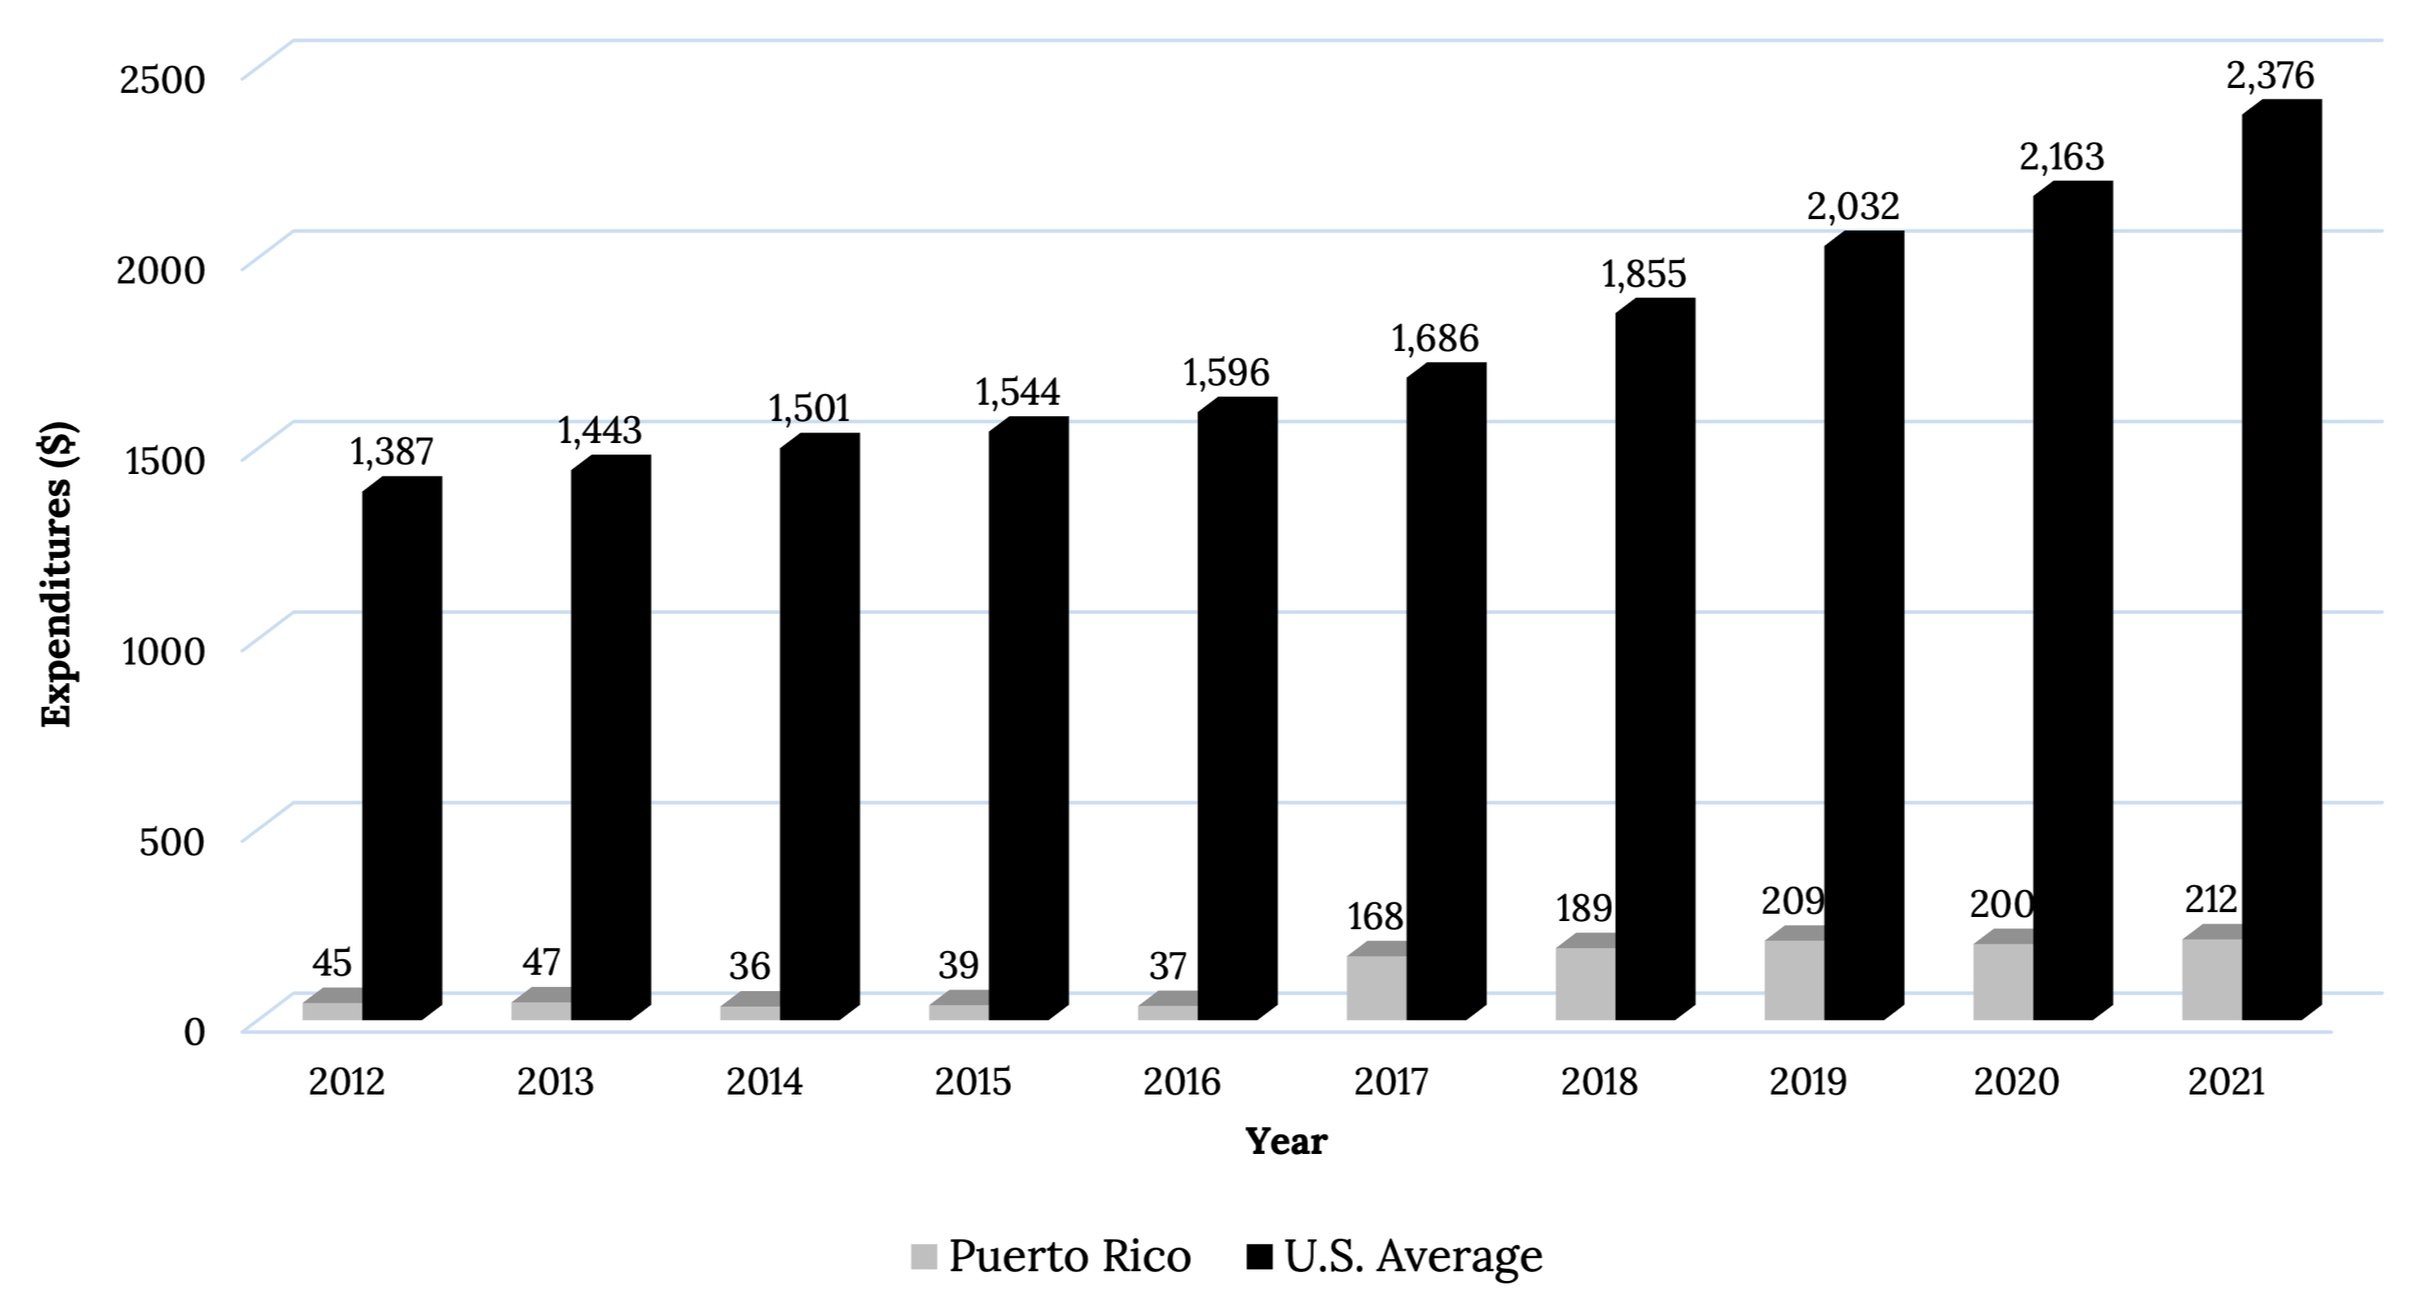
Moreover, analyzing R&D expenditures per capita (Table 4) provides insights on the level of investment in R&D on a per-person basis within a given population. Similarly, to compare Puerto Rico's R&D expenditures with those of the United States, the expenditures also were normalized by considering the percentage of the population dedicated to R&D. Puerto Rico ranks at the bottom (#52) compared to the 50 states and territories in terms of R&D expenditures per capita (Appendix B). This indicates that, on average, individuals in Puerto Rico benefit from fewer resources allocated towards R&D activities compared to their counterparts in other U.S. regions. Figure 3 shows PR’s R&D expenditures per capita for the last ten years compared to the national average.
Table 4: R&D Expenditures per capita
Figure 3: R&D Expenditures per capita (PR & US) from 2012 to 2021. The graph compares R&D expenditures per capita between Puerto Rico and the U.S. average from 2012 to 2021. Puerto Rico's R&D expenditures were significantly lower than the U.S. average throughout the period. From 2012 to 2016, Puerto Rico's expenditures were relatively steady, although the data does not include business R&D performance, while the U.S. average steadily increased from $1,387 to $1,544. Starting in 2017, R&D from Puerto Rico have been increasing each year, reaching $212 per capita in 2021. Meanwhile, the U.S. average continued its upward trend, growing from $1,686 in 2017 to $2,376 in 2021. Despite the increase in Puerto Rico's R&D spending, it remains significantly lower than the U.S. average.
Expenditures on R&D are crucial for fostering innovation, driving economic growth, and maintaining competitive advantage. In an article written by Matt Clancy [20] based on the study of Jones and Summers [21], a method for calculating the average social returns as a result of expenditures made on R&D activities is established. The return of R&D can be calculated as follows:
where g is the annual growth rate of GDP per capita when we do R&D, s is the annual share of GDP spent on R&D, and r is the interest rate.
In the US, between 2012 and 2021, the average annual share of GDP spent on R&D was about 2.92%, therefore s = 0.0292. Over the same period, GDP per capita grew on average, by about 3.46% per year, therefore g = 0.0346. According to the article, in the U.S., a common interest rate to use might be 5%, so that r = 0.05 [20]. With g = 0.0346, s = 0.0292, and r = 0.05, this results in a benefit to cost ratio of 23.7. This means that every dollar invested in R&D generates $23.70 in economic benefits.
Such a high return highlights the critical role that R&D plays in driving economic growth, innovation, and competitiveness. It demonstrates that R&D investments not only yield substantial financial returns but also contribute to broader societal advancements by fostering technological progress and improving productivity across various industries.
Higher Education Research and Development Headcount
R&D headcount refers to the total number of individuals employed in R&D activities. R&D personnel includes researchers, R&D technicians, and support staff from higher education institutions. Table 5 and Figure 4 show R&D headcount of higher education for a ten-year period (2013 to 2022).
Table 5: Puerto Rico Higher Education R&D Headcount
Figure 4: Puerto Rico Higher Education R&D Headcount from 2013 to 2022. The graph depicts the headcount of higher education R&D personnel from 2013 to 2022. The trend shows a general decline over this period. The headcount rose slightly from in 2012 to a peak in 2014, before starting to decrease significantly, dropping in 2016 and further by 2018. There was a modest recovery in 2019. Note that there is a gap between 2019 and 2022, as R&D headcount data was not available for the years 2020 and 2021. In 2022, the headcount decreased again.
In 2022, Puerto Rico had a higher education R&D headcount of 1,296, while the United States had a higher education R&D headcount of 1,030,999 [10]. To properly compare the R&D higher education headcount between Puerto Rico and the United States, these figures were normalized based on the population per 100,000 habitants. Thus, PR had a headcount of 40 per 100,000 habitants and U.S. had 309 per 100,000 habitants. This normalization allows for a more accurate comparison by accounting for the significant difference in population sizes between Puerto Rico and the United States.
This analysis of higher education headcount per 100,000 habitants (Table 6) reveals significant variations between Puerto Rico (PR) and the United States (US). The gap between Puerto Rico and the United States has widened over time, with the U.S. showing growth while Puerto Rico's figures declined. In the latest available data, PR ranks last (#52) compared to the 50 states and its territories (Appendix C) in terms of higher education headcount per 100,000 habitants. This data suggests that while the United States has maintained and increased its R&D workforce relative to its population, Puerto Rico has experienced a decline, which could indicate challenges in retaining or attracting R&D professionals.
Table 6: Higher Education R&D Headcount per 100,000 habitants (PR & US)
Figure 5: Higher Education Headcount per 100,000 Habitants (PR & US) from 2013 to 2022. The graph compares higher education R&D headcount per 100,000 habitants between Puerto Rico and the U.S. average from 2013 to 2022. Throughout this period, the U.S. average consistently remained significantly higher than Puerto Rico. The U.S. average fluctuated slightly, gradually rising until 2022. In contrast, Puerto Rico experienced a notable decline. Starting in 2015, Puerto Rico's R&D headcount per 100,000 habitants began to decline and further decrease by 2022. The data for 2020 and 2021 for Puerto Rico were not available, but the overall trend indicates a steady decline in Puerto Rico's R&D headcount per 100,000 habitants compared to the relatively stable and higher U.S. average.
Full-Time Equivalent (FTE) researchers per 100,000 habitants in 2022 (Figure 6) offers further insight into the discrepancies between PR and the U.S. average. FTE researchers represent the number of individuals engaged in research activities on a full-time basis, adjusted to reflect the equivalent workload of full-time employees.
In 2022, PR had 19 FTE researchers per 100,000 habitants, while the U.S. had an average of 147 FTE researchers per 100,000 habitants. This difference highlights a notable shortage of dedicated research personnel within PR's higher education institutions compared to the national standard. According to the data, PR ranks last (#52) compared to the 50 states and its territories (Appendix D) in terms of higher education FTE researchers per 100,000 habitants.
Figure 6: United States FTE Researchers per 100,000 habitants from year 2022. The map illustrates the number of full-time equivalent (FTE) researchers per 100,000 habitants across the United States and Puerto Rico in 2022. A clear disparity is observed between Puerto Rico and the U.S. states. Puerto Rico has the lowest count at 19 FTE researchers per 100,000 habitants, which is significantly lower than any U.S. state. In contrast, states like Massachusetts and Colorado exhibit much higher numbers, with 400 and 305 FTE researchers per 100,000 habitants, respectively. Other states also show robust numbers, typically ranging from around 70 to over 200 FTE researchers per 100,000 habitants, reflecting a much stronger R&D presence compared to Puerto Rico. This difference highlights the need for enhanced investment and support for research activities in Puerto Rico to bridge the gap with the mainland U.S.
Business Research and Development Headcount and FTEs
Private companies are the primary drivers of R&D activities in Puerto Rico. The 2022 Research and Development Investment Survey in Puerto Rico reports an R&D headcount of approximately 3,400, which translates into about 2,400 FTE researchers [6]. Figure 7 and Table 7 show business R&D headcount and FTE researchers from 2009 to 2022.
Figure 7: Puerto Rico Business R&D Headcount and FTEs. The graph illustrates the trends in Puerto Rico's business R&D headcount and full-time equivalents (FTE) from 2009 to 2022. The headcount decreased from 2009 to 2012, followed by a slight increase in 2015, and a significant rise in 2022. Conversely, the number of FTEs shows a steady increase over the years. Overall, while the R&D headcount initially declined before rebounding, the FTEs consistently increased, indicating a growing commitment to full-time R&D roles in Puerto Rico's business sector.
Table 7: Puerto Rico Business R&D Headcount and FTEs
Between 2015 and 2022, the business sector and higher education experienced contrasting trends in R&D headcount. The business sector saw a significant increase in its R&D workforce, growing from 2,490 to 3,400, a 36.5% rise. This suggests a robust expansion in private sector investment in research and development, potentially driven by the need for innovation and technological advancements. In stark contrast, higher education faced a substantial decrease in its R&D headcount, dropping from 2,723 to 1,296, a 52.4% decline. This sharp reduction may indicate challenges such as reduced funding, shifting priorities within academic institutions, or a migration of researchers to other sectors. In the business sector, this translates to 75 FTE researchers per 100,000 habitants while higher education has 19 FTE researchers per 100,000 habitants. The disparity in FTE densities underscores the growing dominance of the business sector in driving research and innovation, while highlighting potential challenges and the need for strategic support in the higher education sector to sustain and enhance its research contributions.
Patents
The number of patents granted for Puerto Rico (Table 8) have been increasing slightly, indicating potential growth and innovation within the region. This trend is reflected in Figure 8.
Table 8: Patents Granted in PR
Figure 8: Number of Patents Granted in PR from 2011 to 2020. The graph shows the number of patents granted in Puerto Rico from 2011 to 2020. Over the decade, there has been a general upward trend in the number of patents granted, with some fluctuations. This trend indicates growing innovation and patent activity in Puerto Rico over the period.
In 2020, Puerto Rico was granted 72 patents while the United States was granted 164,572 [15]. To compare this numbers, the amount of patents granted was normalized with the population per 100,000 habitants (Table 9). Puerto Rico was granted 2 patents per year per 100,000 habitants. In contrast, the United States, on average, was granted 50 patents per year per 100,000 habitants. Furthermore, when comparing Puerto Rico's patent activity to that of the 50 states and territories, Puerto Rico ranks 48th out of 52 (Appendix E). Figure 9 shows the comparison for the number of patents granted per 100,000 habitants between Puerto Rico and United States from 2011 to 2020.
Table 9: Patents Granted in PR and U.S. per 100,000 habitants
Figure 9: Number of Patents Granted per 100,000 habitants (PR & US) from 2011 to 2020. The graph shows the number of patents granted per 100,000 habitants in Puerto Rico compared to the U.S. average from 2011 to 2020. Throughout this period, Puerto Rico consistently had significantly fewer patents per 100,000 habitants than the U.S. average. Until 2017, Puerto Rico had 1 patent per 100,000 habitants, while the U.S. average steadily raised. In 2018, Puerto Rico's patents per capita increased to 2 and remained at this level through 2020. In comparison, the U.S. average ranged from 44 to 51 patents per 100,000 habitants during these years. This data highlights the significant disparity in patent activity between Puerto Rico and the U.S. average.
Publications and Citations
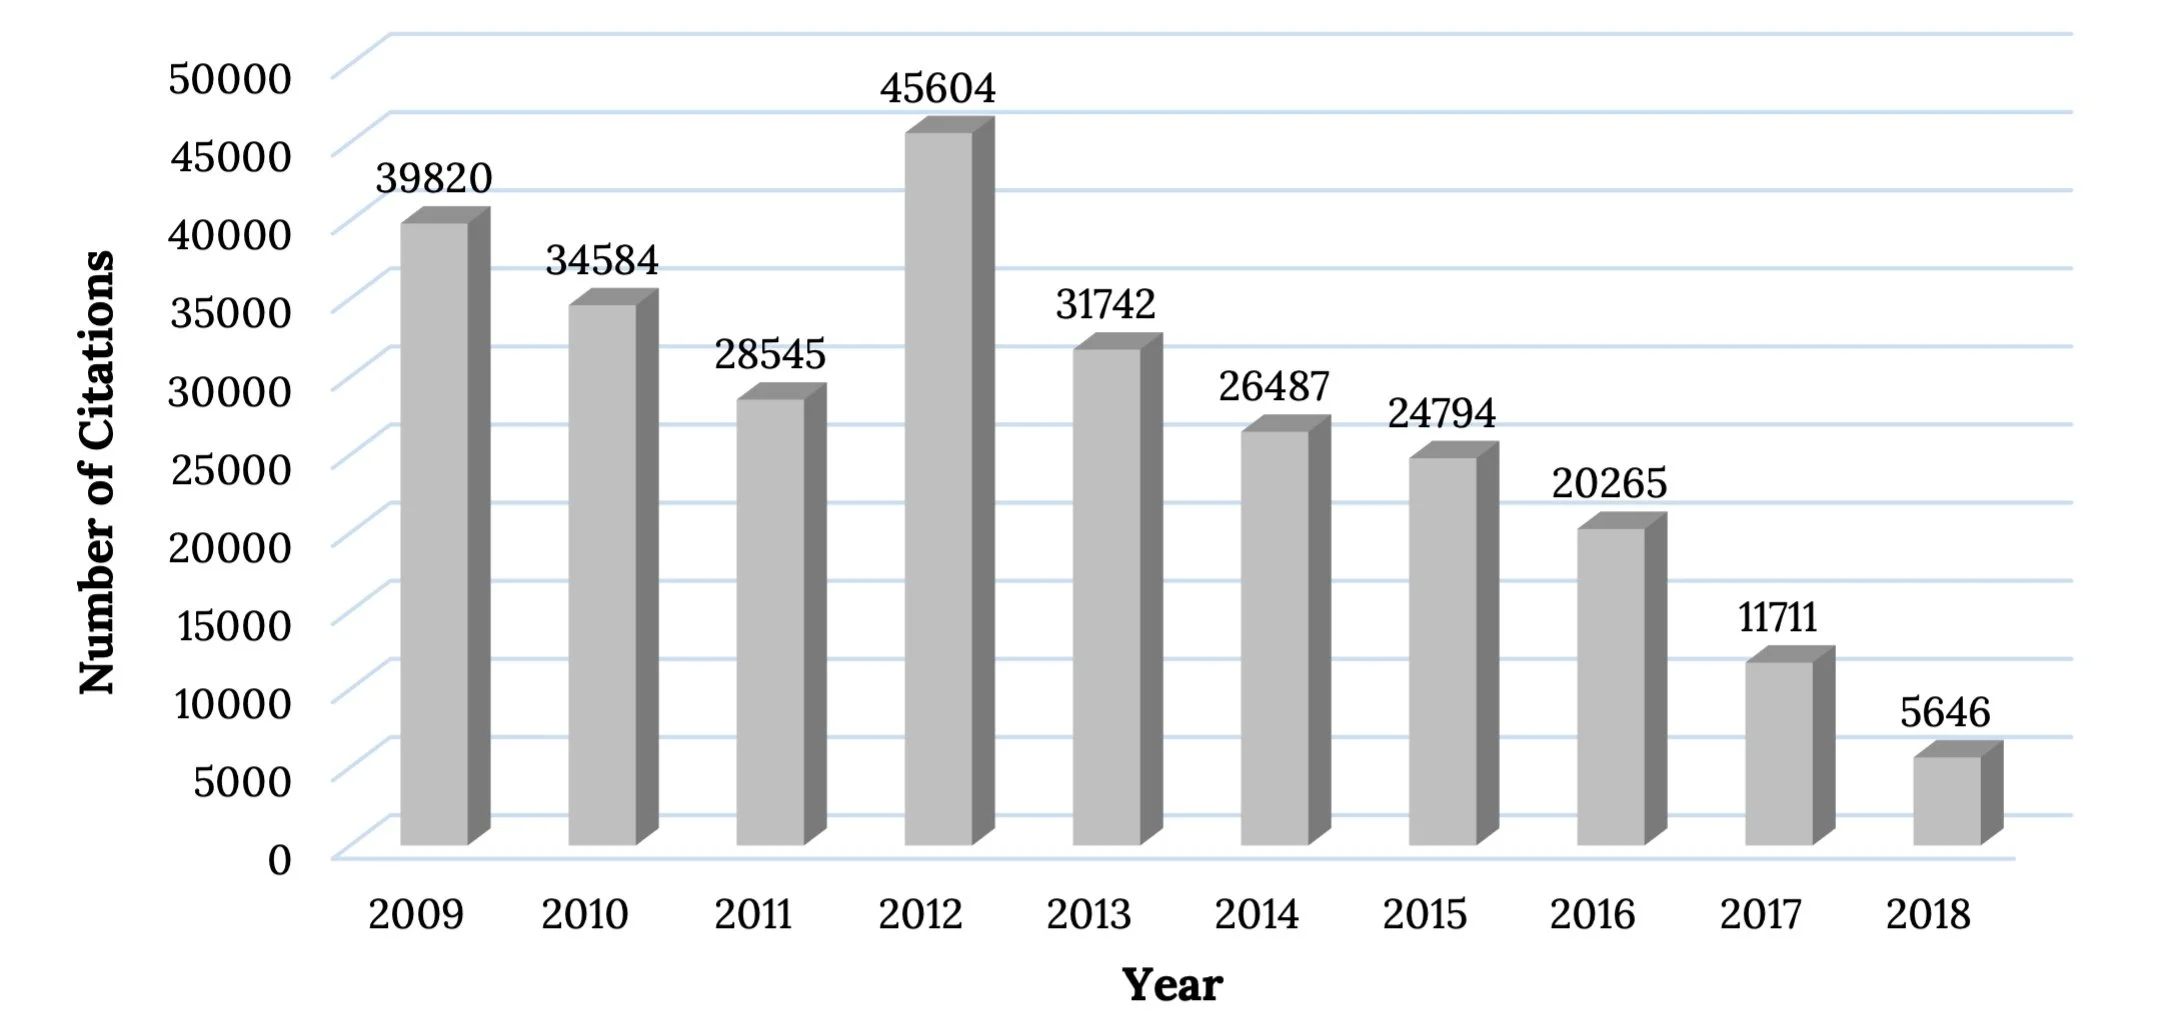
In general, despite variations, the number of publications from Puerto Rico have shown a slight growth over the past decade. On average, the UPR produces 68% the total publications and citations in Puerto Rico. Figure 10 shows the number of publications from PR while Figure 11 shows the number of citations from PR from 2009 to 2018.
Figure 10: Puerto Rico Publications from 2009 to 2012. The graph illustrates the number of publications from Puerto Rico from 2009 to 2018. Over this period, there is a noticeable upward trend in the number of publications. Overall, this trend indicates a growing research output from Puerto Rico over the ten-year period.
Figure 11: Puerto Rico Citations from 2009 to 2018. The graph depicts the number of citations from Puerto Rico from 2009 to 2018. The trend shows a general decline over the years. This overall declining trend indicates a reduction in the number of times Puerto Rican research publications were cited over this decade.
STEM Workforce
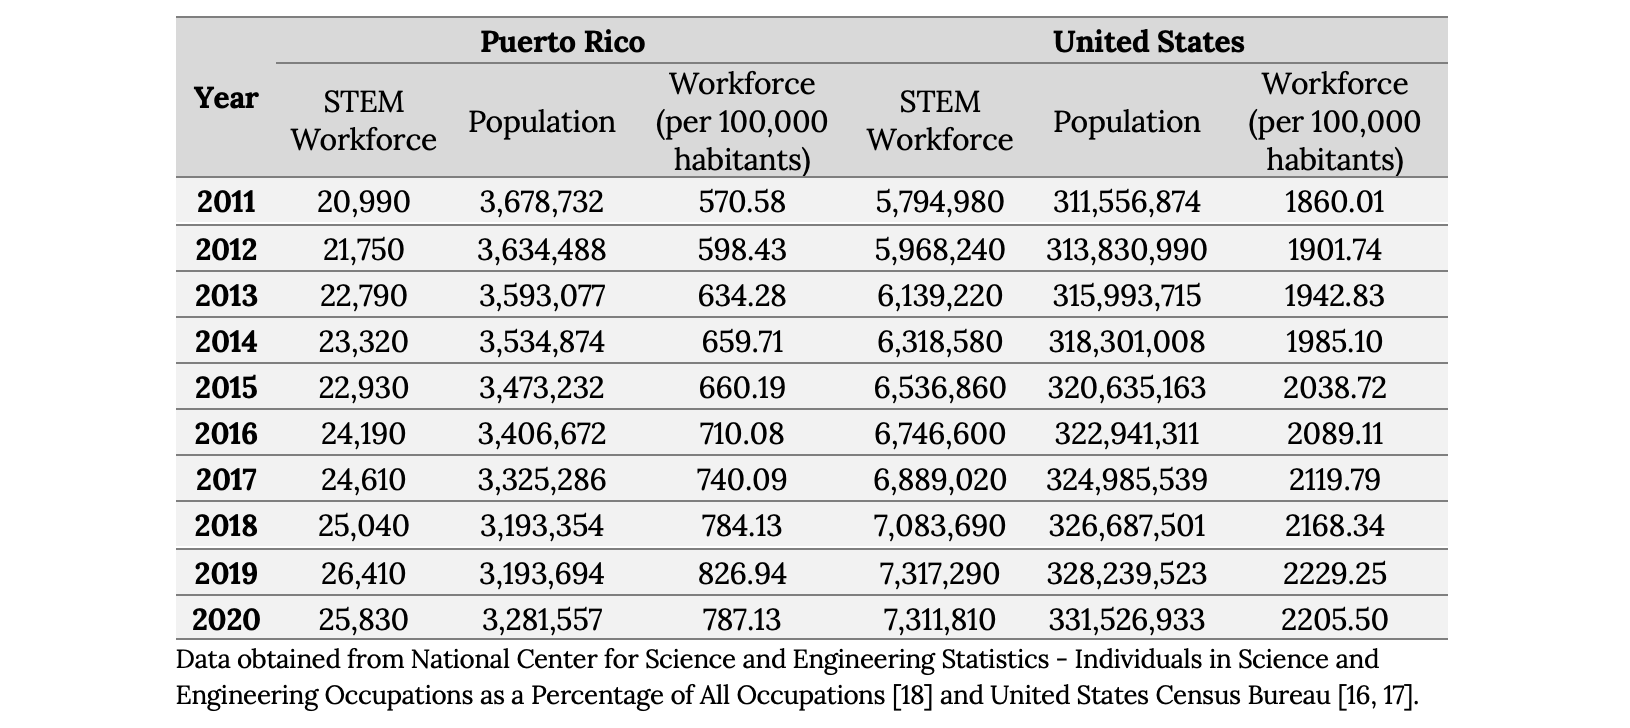
The data for STEM workforce in Puerto Rico (Table 10), includes engineers, computer, mathematical, life, physical, and social scientists, as well as postsecondary teachers in these fields.
Table 10: Puerto Rico STEM Workforce
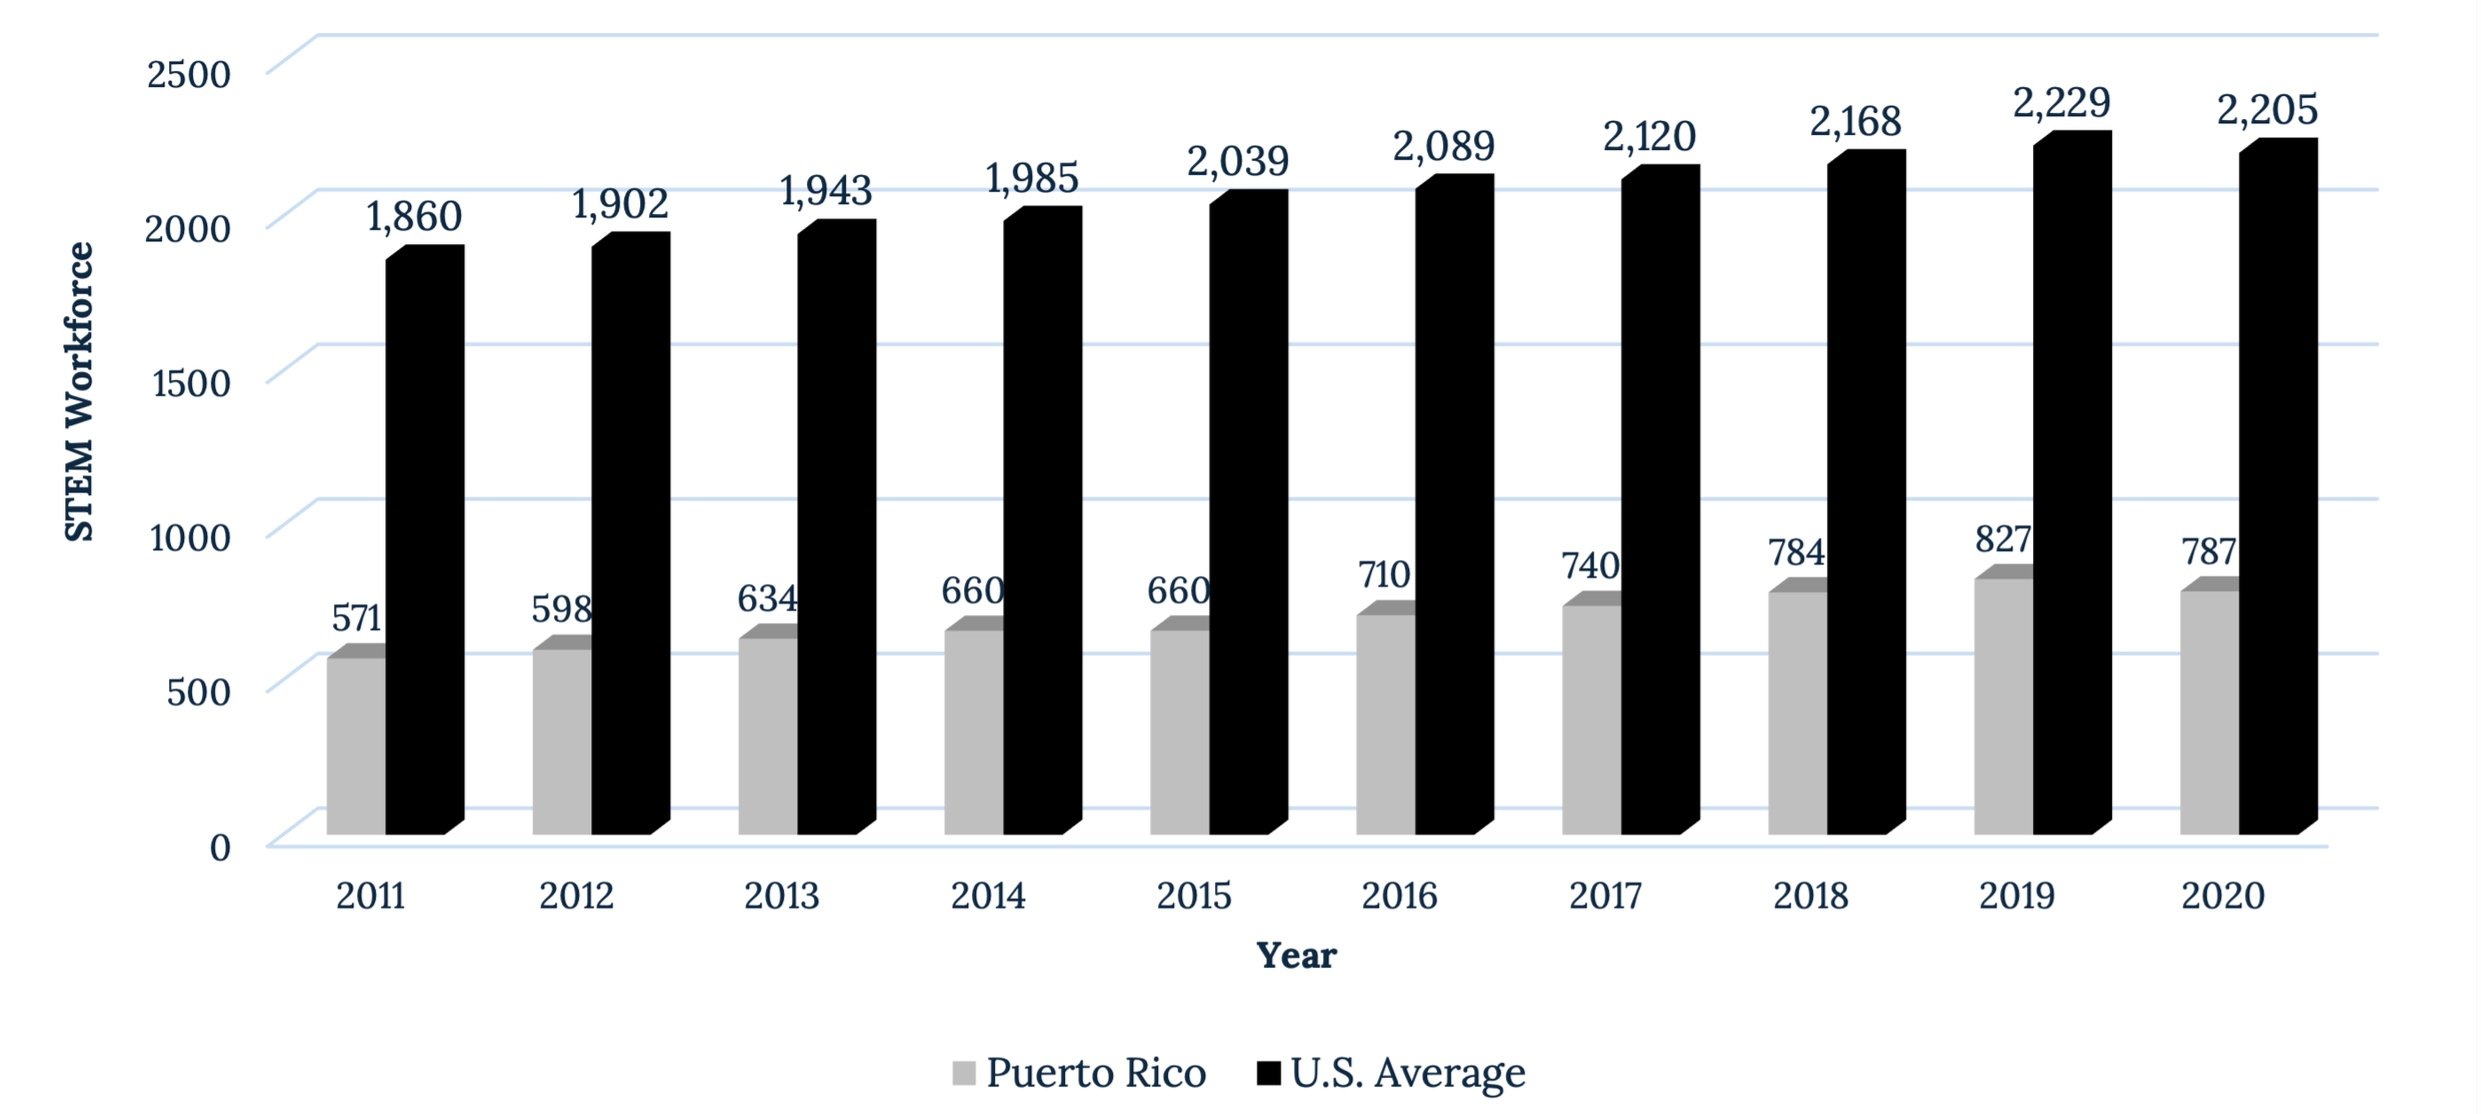
In 2020, Puerto Rico had a STEM workforce of 25,830 individuals, resulting in a STEM workforce density of 787 per 100,000 habitants. In comparison, the United States had a STEM workforce of 7,311,810 individuals, yielding a STEM workforce density of 2,205 per 100,000 habitants [18]. This comparison highlights a significant disparity in STEM workforce density between Puerto Rico and the United States average. Specifically, the United States' STEM workforce density is approximately 2.8 times higher than that of Puerto Rico. This indicates a much higher concentration of STEM professionals per capita in the United States compared to Puerto Rico. Figure 12 shows the comparison for the STEM workforce per 100,000 habitants between Puerto Rico and United States from 2011 to 2020.
Table 11: STEM Workforce in PR and U.S. per 100,000 habitants
Figure 12: STEM Workforce per 100,000 habitants (PR & US) from 2011 to 2020. The graph shows the STEM workforce per 100,000 habitants from 2011 to 2020 for Puerto Rico and the U.S. average. Over the decade, Puerto Rico's STEM workforce has steadily increased, as well as the U.S. average. Despite both showing upward trends, the U.S. average consistently maintains a significantly higher STEM workforce 100,000 habitants compared to Puerto Rico throughout the entire period.
When comparing Puerto Rico's STEM workforce density to that of the 50 states and territories, Puerto Rico ranks last (#52) (Appendix F). Despite ranking last among the 50 states and territories, Puerto Rico showed a consistent increase in its STEM workforce over the years, demonstrating potential growth and development within STEM-related industries.
STEM Education
The data for STEM Education in Puerto Rico (Table 12), encompass degrees conferred for diverse disciplines such as agricultural sciences, biological sciences, computer sciences, engineering, geosciences, mathematics, physical sciences, psychology, and social sciences.
Table 12: Puerto Rico STEM Education
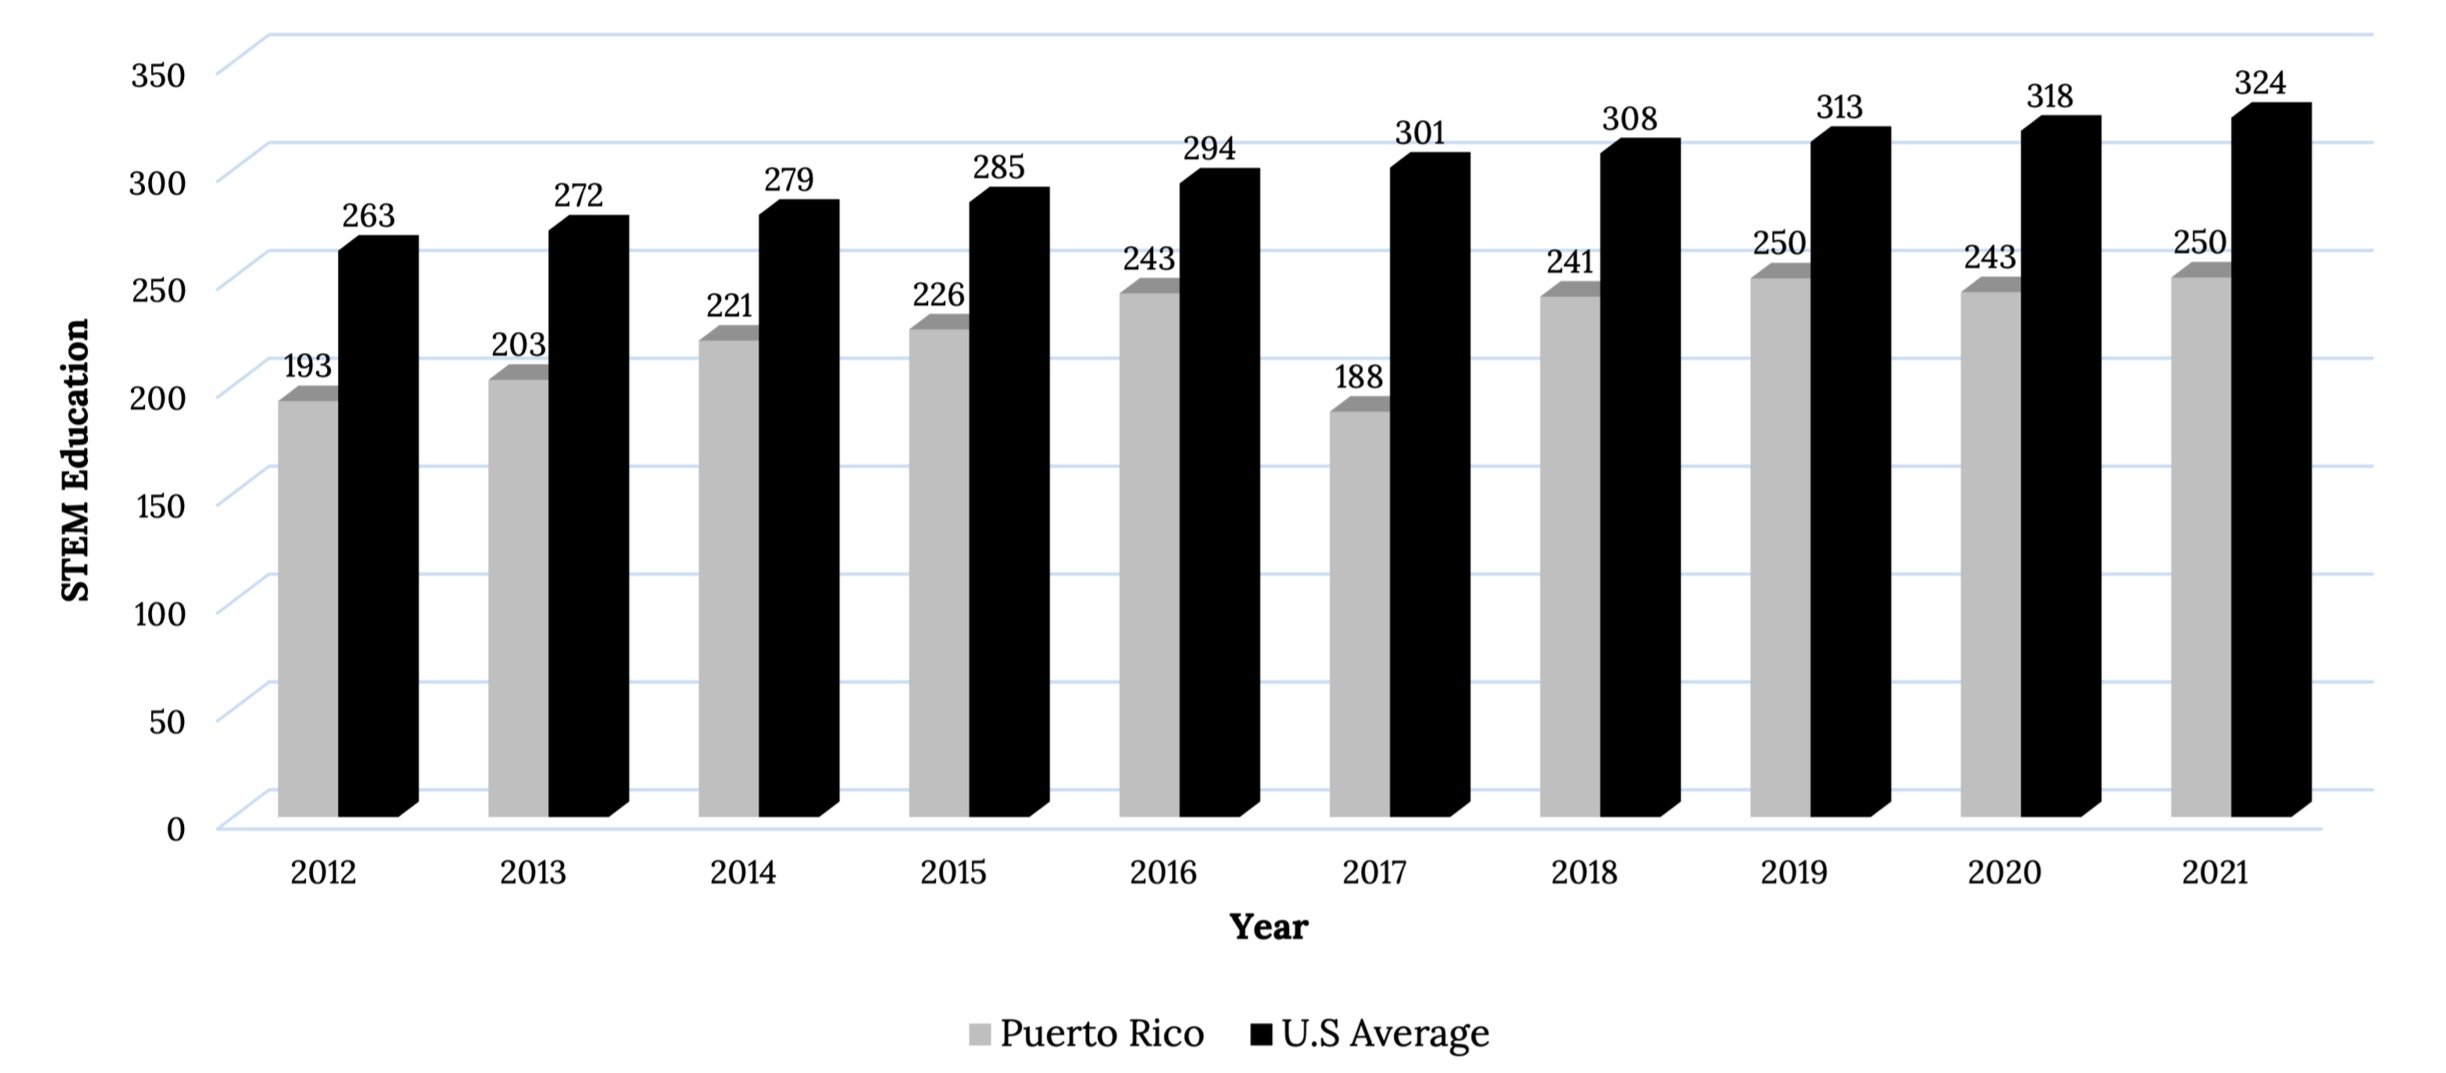
In 2021, 8,159 degrees were conferred in Puerto Rico while 1,076,346 degrees were conferred in the United States related to STEM [19]. To properly compare PR with U.S. STEM education density (measured as the number of STEM degrees conferred per 100,000 habitants) was determined (Table 13). In Puerto Rico, the STEM education rate per 100,000 habitants is 250, while in the United States, it is 324. Figure 13 shows the comparison for the STEM Education per 100,000 habitants between Puerto Rico and United States from 2012 to 2021. Comparatively, Puerto Rico's STEM education density is notably lower than that of the United States.
Table 13: STEM Education in PR and U.S. per 100,000 habitants
Figure 13: STEM Education per 100,000 habitants (PR & US) from 2012 to 2021. The graph displays the STEM education per 100,000 habitants from 2012 to 2021 for Puerto Rico and the U.S. average. Puerto Rico shows a gradual increase in STEM education numbers. Conversely, the U.S. average consistently remains higher than Puerto Rico's throughout the period. While both Puerto Rico and the U.S. have experienced growth in STEM education, the U.S. average remains significantly higher each year.
Similarly to STEM Workforce, despite some variability, there is a general positive trajectory in the STEM education within Puerto Rico. Puerto Rico's STEM education landscape, as assessed by the concentration of higher education degree awards per 100,000 habitants across various disciplines, positions the territory at the 39th rank out of 52 when compared to the 50 states and its territories (Appendix G).
Recommendations
Based on the data and findings in this report, as well as interviews with numerous stakeholders from within and outside Puerto Rico on R&D matters, the authors have concluded that a comprehensive approach to advancing Puerto Rico's R&D landscape is imperative. The following recommendations are critical to achieve this goal. However, the authors acknowledge that expanding R&D and the knowledge-based economy presents complex challenges requiring multiple initiatives and broad participation. We encourage other sectors and leaders to actively engage in proposing and leading these necessary changes.
1. Development of a broader Science and Technology (ST) Policy for Puerto Rico
The data reveals the importance of collaboration and alignment across diverse sectors. Thus, there is a need for developing a broader Science and Technology (ST) policy framework. In fact, having such a policy is very common in the states and is a requirement mandated by the U.S. Congress to be eligible for many Established Program to Stimulate Competitive Research (EPSCoR) programs. This involves fostering collaboration across diverse sectors, drawing on the expertise of entities such as the Department of Economic Development and Commerce (DEDC), American Association for the Advancement of Science (AAAS) Puerto Rico Chapter, Puerto Rico Science, Technology, and Research Trust (PRSTRT), industry leaders, and academia. Convening these stakeholders, ensures that policies are informed by a holistic understanding of the needs and opportunities within the ST landscape leading to better allocation and potentially increased funding for R&D activities. Additionally, redefining the roles and responsibilities of the PRSTRT is required to optimize its effectiveness as a driver of ST initiatives. This entails empowering the PRSTRT to play a more proactive and strategic role in shaping Puerto Rico's ST agenda. In many states, the development ST is mandated by the governor. However, in Puerto Rico, it can also be developed either through directives from DEDC or as a law passed by the Legislature, which mandates a specific government entity or the PRSTRT to act.
2. Creation of a permanent R&D office at DDEC
The absence of continuous and recent data on R&D activities in Puerto Rico underscores the need for a centralized entity dedicated to the planning, coordination, and monitoring of R&D efforts. Without consistent data, it is challenging to assess progress, allocate resources efficiently, and make informed decisions. A permanent R&D office at the DEDC would serve as a central hub for coordinating ST-related efforts, including data management, oversight, and stakeholder engagement. By consolidating these functions within a dedicated entity, coordination, efficiency, and accountability in Puerto Rico's R&D activities can be enhanced.
This proposed office is not intended to add another layer to the bureaucratic structure, but instead, it aims to focus on the strategic planning and execution of measures promoting the growth of science, technology, and innovation across Puerto Rico. Functioning as an integrated hub, this office will assemble a multi-disciplinary team of scientists, technologists, engineers, and economists, united by their commitment to fostering innovation and economic prosperity. It's essential to clarify that the proposed office's remit extends beyond the current scope of the PRSTRT, which is primarily oriented towards funding and supporting scientific research. This office will instead play an integral role in fostering and strengthening ties with a diverse array of stakeholders, such as universities, industries, and other government bodies, to nurture a collective vision for R&D development.
The office’s main function will be to devise and put into action a comprehensive R&D strategy for Puerto Rico. This strategy will aim to enhance our technological competencies, stimulate scientific research, and encourage the creation of innovation-driven startups. Moreover, it will focus on promoting high-value job opportunities within these expanding sectors. This office will not be merely reactive, but proactive, continuously identifying and advocating for policies aimed at attracting both domestic and foreign investment into our burgeoning R&D sphere. The office's policy advice and recommendations will differ from those provided by the PRSTRT as it will concentrate on broader legislative changes and the creation of an ecosystem favorable R&D growth.
The proposed office is envisioned as a unifying force, integrating the efforts of the government, academia, and the private sector to propel Puerto Rico's R&D growth. By spearheading these vital partnerships, the office will help ensure that science, technology, and innovation become pivotal to our economy and society. This strategic approach will differentiate our initiative from existing structures, and critically, it will help engrain sustainable economic growth in our economic framework. With this initiative, we aim to position Puerto Rico as a formidable player on the international stage, capitalizing on our unique strengths.
3. Create Science and Technology (ST) advisor position at the Governor’s office
The data reveals significant discrepancies across all key performance indicators (KPIs) between Puerto Rico and the United States. Hence, a ST Advisor can play a critical role in bridging the gaps between various sectors, promoting greater collaboration and resource sharing. This advisor would provide expert counsel to the Office of the Governor on the development of ST programs and initiatives, ensuring that ST considerations are integrated into broader policy discussions. Additionally, under the leadership of the ST Advisor, a Scientific Council can be established to provide actionable recommendations for ST policy formulation and implementation. Increased advocacy and strategic alignment can lead to higher and more consistent R&D funding, as well as an enhanced coordination and investment in R&D can create more jobs and opportunities in the field. By focusing on strategic priorities and leveraging available resources, this position can help close the gap between Puerto Rico and the mainland U.S.
4. Address the gaps to boost government R&D expenditures
Other states and territories define R&D expenditures in their local budgets by specifying funds allocated to R&D activities across various sectors such as education, health, technology, and industry. Proper categorization of these expenditures is crucial as it ensures transparency, allows for effective tracking of investment outcomes, and facilitates informed decision-making regarding resource allocation. Increasing R&D expenditures at the state level is important because it drives innovation, fosters economic growth, enhances competitiveness, and addresses local challenges through advanced research solutions. Investing in R&D also attracts businesses, creates high-paying jobs, and supports the development of a skilled workforce, ultimately contributing to the overall prosperity and well-being of the state. Unfortunately, this is not the case in Puerto Rico. It involves clearly defining what constitutes R&D expenditures across government entities in collaboration with the Puerto Rico Office of Management and Budget (OMB). By ensuring accurate categorization of R&D expenditures, budget allocation can be optimized, as well as the impact of government-funded research initiatives. After proper accounting, the government needs to increase funding for R&D and for organizations such as the PRSTRT and the University of Puerto Rico to support their R&D activities.
5. Changes to incentives code (Act 60)
Act 60, known as the Puerto Rico Incentives Code, was enacted in July 2019 to consolidate and simplify various tax incentive programs, aiming to stimulate economic development by offering tax benefits to businesses and individuals investing on the island. These incentives cover sectors such as manufacturing, tourism, technology, renewable energy, finance, and export services, and include reduced or zero corporate income tax rates, property tax exemptions, and other local tax exemptions. Individual investors who become bona fide residents of Puerto Rico can benefit from exemptions on certain income types, such as capital gains. Act 60 also encourages job creation, supports R&D activities to promote innovation, and provides tax incentives for companies exporting services.
While Act 60 provides incentives for both industry and academia, it has primarily benefited the industrial sector. This imbalance indicates a need to revise the incentives to better facilitate collaboration between academia and industry. Academic institutions are crucial for foundational research, innovation and commercialization, but they often lack the resources and support that industry partners receive. Addressing this disconnect can foster a more integrated and dynamic R&D ecosystem. This includes encouraging partnerships between industry and academia to facilitate technology transfer and innovation. Additionally, comprehensive funding initiatives aimed at enhancing Puerto Rico's R&D ecosystem, attracting talent, and modernizing infrastructure should be developed. Streamlining and enhancing procedures to secure incentives are also crucial to reducing bureaucratic hurdles for R&D ventures.
6. Establishment of a liaison program to bridge industry and academia
Presently, most patents and publications originate from academic institutions, with minimal integration of industry input, resulting in isolated innovation efforts. The establishment of a liaison program to bridge industry and academia could significantly improve joint innovation by addressing the current lack of collaboration between these two sectors. This program would facilitate innovation-driven partnerships, proactively identify collaboration opportunities, and provide guidance on contracts, intellectual property rights, and collaboration barriers. It is recommended to extend the support for this program to all academic institutions through financial backing from DEDC and ensuring collaboration with UPR graduate campuses through liaison officers.
The liaison program will have the aim of enhancing local initiatives, bridging existing gaps, and capitalizing on emerging prospects. This program will function to supplement ongoing endeavors and strategically tackle areas of need and potential growth. The liaison program can assist in identifying the assets available related to science, technology, and research for industries to assist them in addressing innovation challenges and opportunities serving as a bridge, connecting academia and industry to achieve shared goals and mutual benefits.
Among the services that can be offered by the program are: (1) facilitate innovation-driven partnerships between businesses and universities, (2) proactively identify collaboration opportunities, (3) serve as a central hub for innovation and research-sharing, (4) develop feedback mechanisms to ensure productive collaborations, (5) organize regular networking events and workshops, (6) offer guidance on contracts, intellectual property rights, and collaboration barriers, (7) create new R&D and technical assistance collaborations between companies and university research assets, and (8) identify local efforts to promote academic-industry innovation engagements. By fostering proactive partnerships, this program would facilitate the merging of academic research capabilities with industry expertise and resources.
7. Establishment of R1 Institutions
The trends related to R&D expenditures and higher education headcount highlight the need for the establishment and development of R1 universities in Puerto Rico, based on the Carnegie Classification, since they are essential for expanding the island's research base and fostering a robust innovation ecosystem. An R1, or Research-Intensive University, is distinguished by high levels of research activity, substantial undergraduate and graduate programs, and extensive research expenditures. For the 2025, to become a R1 institution, an institution must meet a threshold of $50 millions in research expenditures and 70 doctoral research/scholarship degrees awarded [22].
Currently, Puerto Rico’s R&D expenditures per capita and as a percentage of GDP significantly lag the United States, indicating a critical need for enhanced research capacity and infrastructure. It is recommended to transform the University of Puerto Rico Mayagüez (UPRM) and University of Puerto Rico Río Piedras (UPRRP) into R1 Institutions. UPRM spends $18 millions in R&D activities while UPRRP spends $28 millions [11]. Although the Medical Sciences Campus of the UPR has high levels of R&D expenditures ($47.5 millions), according to the definition of R1 institution it does not have substantial PhD programs. Hence, UPRM and UPRRP are the best fit to become R1 Institutions, complementing the research activities currently at Medical Sciences Campus. By transforming existing institutions into R1 universities, Puerto Rico can catalyze innovation, retain and attract talent, and stimulate economic growth through extensive research endeavors. This transformation would not only elevate the quality and scope of academic research but also foster collaboration across sectors, ultimately contributing to the advancement of knowledge and addressing local and global challenges.
Conclusion
The findings presented underscore the need for heightened investment and the implementation of policies to advance R&D efforts in Puerto Rico. The disparities revealed in R&D expenditures, workforce numbers, patent activity, and educational attainment emphasize the necessity for concerted action from government, private sector entities, and non-profit organizations. Also, there is the need to enhance incentives, local funding, and programs aimed at facilitating research. To effectively address these gaps, it is necessary to allocate more resources towards R&D, incentivize innovation, and foster a conducive environment for research-driven economic growth. Moreover, these changes require the development of new public policies and a clear recognition of priorities.
However, achieving these goals requires more than just financial resources; it demands a commitment to data visibility and transparency. Accurate and accessible data serve as the foundation for informed decision-making and effective policy formulation. Without accurate and accessible data, stakeholders cannot make informed decisions or measure the impact of interventions effectively. Therefore, alongside increased investment, enhancing data visibility and transparency should be prioritized to ensure the success of R&D efforts in Puerto Rico.
In this report, KPIs were normalized by population density. However, Puerto Rico's data could also be compared with the United States by averaging the metrics of all states and territories. This approach would offer insight into how Puerto Rico's performance measures up against the national average. Despite this, the results would remain largely unchanged, as Puerto Rico consistently ranks last in most indicators.
References
[1] OECD (2015), Frascati Manual 2015: Guidelines for Collecting and Reporting Data on Research and Experimental Development, The Measurement of Scientific, Technological and Innovation Activities, OECD publishing, Paris.https://www.oecd-ilibrary.org/docserver/9789264239012-en.pdf?expires=1716054228&id=id&accname=guest&checksum=62D2481EB7B89A5C6A8D1907A461728E
[2] Departamento de Desarrollo Económico de Puerto Rico. (2022). Propósito Marco estratégico. https://www.desarrollo.pr.gov/proposito
[3] Instituto de Estadísticas de Puerto Rico (2011). Encuesta piloto de Ciencia y Tecnología 2009: Investigación y Desarrollo (R&D). www.estadisticas.gobierno.pr.
[4] Instituto de Estadísticas de Puerto Rico. (2014). Encuesta sobre Innovación en Empresas de Manufactura 2012-13.www.estadisticas.gobierno.pr.
[5] Instituto de Estadísticas de Puerto Rico. (2016). Encuesta sobre Innovación en Empresas de Manufactura 2014-15.www.estadisticas.gobierno.pr.
[6] Instituto de Estadísticas de Puerto Rico. (2024). Encuesta sobre Innovación en Empresas de Manufactura 2022-23.
[7] National Center for Science and Engineering Statistics. (2023). National Patterns of R&D Resources | 2021 - 2022.https://ncses.nsf.gov/data-collections/national-patterns/2021-2022
[8] National Center for Science and Engineering Statistics. (2022). National Patterns of R&D Resources | 2020 - 2021.https://ncses.nsf.gov/data-collections/national-patterns/2021
[9] U.S. National Science Fountation. (2020). National Patterns of R&D Resources.https://www.nsf.gov/statistics/natlpatterns-legacy/
[10] National Center for Science and Engineering Statistics. (2023). Higher Education Research and Development (HERD) Survey | 2022. https://ncses.nsf.gov/surveys/higher-education-research-development/2022
[11] National Center for Science and Engineering Statistics. (2022). Higher Education Research and Development (HERD) Survey | 2021. https://ncses.nsf.gov/surveys/higher-education-research-development/2021
[12] U.S. National Science Fountation. (2021). Higher Education Research and Development Survey (HERD).https://www.nsf.gov/statistics/srvyherd-legacy/#tabs-2
[13] Instituto de Estadísticas de Puerto Rico. (n.d.). Numbers of patents in Puerto Rico. https://indicadores.pr/km/dataset/numero-de-patentes-de-puerto-rico/resource/55b6a38d-afb7-4801-9960-28d3b01c39dd
[14] U.S. Patent and Trademark Office. (n.d.). Patent Counts by Origin and Type Calendar Year 2019.https://www.uspto.gov/web/offices/ac/ido/oeip/taf/st_co_19.htm
[15] U.S. Patent and Trademark Office. (n.d.). Patent Counts by Origin and Type Calendar Year 2020. https://www.uspto.gov/web/offices/ac/ido/oeip/taf/st_co_20.htm
[16] United States Census Bureau. (n.d.). National Population Totals and Components of Change: 2010-2019. https://www.census.gov/data/tables/time-series/demo/popest/2010s-national-total.html
[17] United States Census Bureau. (n.d.). National Population Totals and Components of Change: 2020-2023. https://www.census.gov/data/tables/time-series/demo/popest/2020s-national-total.html
[18] National Center for Science and Engineering Statistics. (n.d.). Individuals in Science and Engineering Occupations as a Percentage of All Occupations. https://ncses.nsf.gov/indicators/states/indicator/se-occupations-to-all-occupations
[19] National Center for Science and Engineering Statistics. (n.d.). Science and Engineering Degrees as a Percentage of Higher Education Degrees Conferred. https://ncses.nsf.gov/indicators/states/indicator/se-degrees-to-all-higher-education-degrees
[20] Clancy, M. (2021, May 12). What are the returns to R&D?. What are the returns to R&D? . https://mattsclancy.substack.com/p/what-are-the-returns-to-r-and-d
[21] Jones, B., & Summers, L. (2020, September). A Calculation of the Social Returns to Innovation . NATIONAL BUREAU OF ECONOMIC RESEARCH. https://www.nber.org/system/files/working_papers/w27863/w27863.pdf
[22] 2025 Research Designations. CARNEGIE CLASSIFICATION OF INSTITUTIONS OF HIGHER EDUCATION. (2024, March 19). https://carnegieclassifications.acenet.edu/carnegie-classification/research-designations/


